Demystifying Crypto Trading Indicators: A Comprehensive Guide to Navigating the Market
In the dynamic and often unpredictable world of cryptocurrency trading, traders seek tools to gain insights into market trends, identify potential trading opportunities, and make informed decisions. This is where crypto trading indicators come into play. These technical analysis tools provide valuable signals and insights derived from historical price and volume data, helping traders navigate the complexities of the crypto market.
What are Crypto Trading Indicators?
Crypto trading indicators are mathematical computations and chart patterns that analyze price and volume data to provide traders with insights into market trends, momentum, and potential price reversals. These indicators can be categorized into three main types:
- Trend Indicators: These indicators help identify the overall direction of a cryptocurrency’s price movement, indicating whether the market is trending upwards (bullish) or downwards (bearish). Examples include moving averages, trendlines, and MACD (Moving Average Convergence Divergence).
- Momentum Indicators: These indicators measure the speed and magnitude of price movements, helping traders identify overbought or oversold conditions and potential reversals. Examples include the Relative Strength Index (RSI), Stochastic Oscillator, and Bollinger Bands.
- Volume Indicators: These indicators measure the trading activity or volume of a cryptocurrency, providing insights into market sentiment and potential price movements. Examples include On-Balance Volume (OBV), Moving Average Volume (MAV), and Chaikin Oscillator.
Also read: What are Telegram Trading Bots?
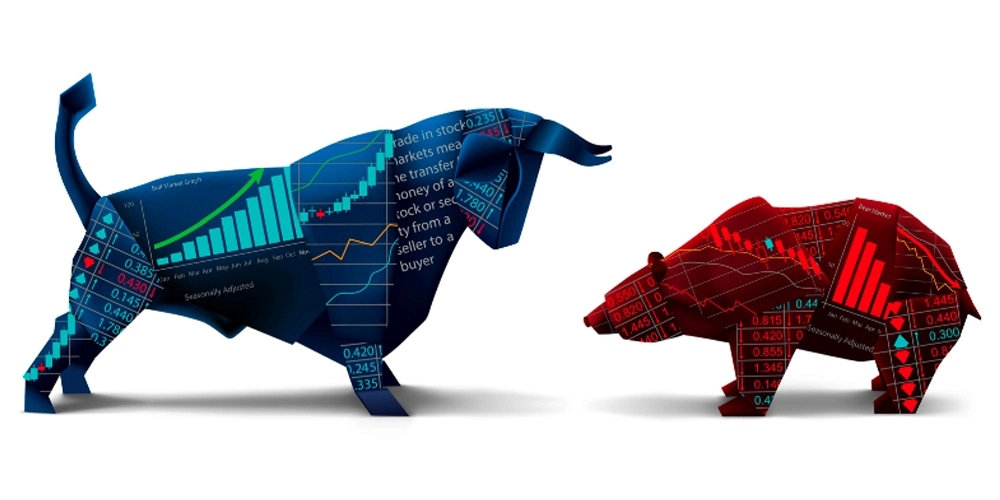
Crypto Trading Indicators
While crypto trading indicators can be valuable tools, it is crucial to use them effectively to avoid misinterpretations and make sound trading decisions. Here are some guidelines for using crypto trading indicators:
- Understand the Indicator: Before using an indicator, thoroughly understand its purpose, calculation, and interpretation to avoid misinterpreting its signals.
- Combine Indicators: Use multiple indicators from different categories to gain a more comprehensive picture of the market and reduce the risk of false signals.
- Consider Market Context: Analyze indicators in the context of overall market conditions, news events, and fundamental factors to make informed decisions.
- Backtest and Experiment: Backtest indicators on historical data to assess their effectiveness and experiment with different parameters to find optimal settings.
- Risk Management: Always prioritize risk management by setting stop-loss orders to limit potential losses and using indicators to identify potential entry and exit points.
Advantages of Using Crypto Trading Indicators
Crypto trading indicators offer several advantages for traders:
- Identify Trends and Reversals: Indicators can help identify potential trend changes and reversals, allowing traders to position themselves accordingly.
- Assess Market Sentiment: Indicators can provide insights into market sentiment, indicating whether the market is overbought or oversold, potentially signaling opportunities.
- Support Trading Decisions: Indicators can serve as valuable tools to support trading decisions, especially when combined with other analysis techniques.
- Automation and Alerts: Some indicators can be automated to generate alerts when certain conditions are met, helping traders stay informed and take timely action.
- Technical Analysis Foundation: Indicators form the foundation of technical analysis, providing a structured approach to market analysis and decision-making.
Limitations of Crypto Trading Indicators
While crypto trading indicators can be beneficial, it is essential to acknowledge their limitations:
- Lagging Indicators: Indicators are based on historical data, so they may not always accurately predict future price movements.
- Overreliance on Indicators: Excessive reliance on indicators can lead to overtrading or ignoring fundamental factors.
- False Signals: Indicators can sometimes generate false signals, leading to incorrect trading decisions.
- Subjectivity and Interpretation: Indicator interpretation can be subjective, and different traders may draw different conclusions from the same signals.
Top 10 popular bearish and bullish crypto trading indicators
Here are two tables that list the top 10 popular bearish and bullish crypto trading indicators, along with a brief description of each:
| Bearish Indicator | Description |
|---|---|
| Death Cross | The death cross occurs when the 50-day moving average crosses below the 200-day moving average. This is often seen as a sign that a bear market is about to begin. |
| Head and Shoulders | The head and shoulders pattern is a bearish chart pattern that is formed when the price makes three peaks, with the middle peak being the highest. This pattern is often seen as a sign that a downtrend is about to begin. |
| Falling Wedge | The falling wedge is a bearish chart pattern that is formed when two converging trendlines meet. This pattern is often seen as a sign that a downtrend is about to continue. |
| Descending Triangle | The descending triangle is a bearish chart pattern that is formed when a horizontal line intersects a downward-sloping trendline. This pattern is often seen as a sign that a downtrend is about to continue. |
| On Balance Volume (OBV) | The OBV is a momentum indicator that measures the volume of buying and selling activity. When the OBV is falling, it suggests that there is more selling pressure than buying pressure, which is a bearish sign. |
| Relative Strength Index (RSI) | The RSI is an oscillator that measures the speed and magnitude of price movements. When the RSI is oversold, it suggests that the price is due for a correction, which is a bearish sign. |
| Moving Average Convergence Divergence (MACD) | The MACD is a momentum indicator that measures the relationship between two moving averages. When the MACD crosses below the signal line, it suggests that a bearish trend is developing. |
| Stochastic Oscillator | The Stochastic Oscillator is a momentum indicator that measures the relationship between the closing price and the price range. When the Stochastic Oscillator is below the oversold line, it suggests that the price is due for a correction, which is a bearish sign. |
| Ultimate Oscillator | The Ultimate Oscillator is a momentum indicator that combines several other momentum indicators into a single indicator. When the Ultimate Oscillator is below the oversold line, it suggests that the price is due for a correction, which is a bearish sign. |
| Volume Weighted Average Price (VWAP) | The VWAP is a moving average that is weighted by volume. When the price is below the VWAP, it suggests that there is more selling pressure than buying pressure, which is a bearish sign. |
| Bullish Indicator | Description |
|---|---|
| Golden Cross | The golden cross occurs when the 50-day moving average crosses above the 200-day moving average. This is often seen as a sign that a bull market is about to begin. |
| Cup and Handle | The cup and handle pattern is a bullish chart pattern that is formed when the price makes a U-shaped curve, followed by a small, upward-sloping handle. This pattern is often seen as a sign that an uptrend is about to continue. |
| Rising Wedge | The rising wedge is a bullish chart pattern that is formed when two converging trendlines meet. This pattern is often seen as a sign that an uptrend is about to continue. |
| Ascending Triangle | The ascending triangle is a bullish chart pattern that is formed when a horizontal line intersects an upward-sloping trendline. This pattern is often seen as a sign that an uptrend is about to continue. |
| On Balance Volume (OBV) | The OBV is a momentum indicator that measures the volume of buying and selling activity. When the OBV is rising, it suggests that there is more buying pressure than selling pressure, which is a bullish sign. |
| Relative Strength Index (RSI) | The RSI is an oscillator that measures the speed and magnitude of price movements. When the RSI is overbought, it suggests that the price is due for a correction, but it can also be a sign that the uptrend is strong. |
| Moving Average Convergence Divergence (MACD) | The MACD is a momentum indicator that measures the relationship between two moving averages. When the MACD crosses above the signal line, it suggests that a bullish trend is developing. |
| Stochastic Oscillator | The Stochastic Oscillator is a momentum indicator that measures the relationship between the closing price and the price range. When the Stochastic Oscillator is above the overbought line, it suggests that the price is due for a correction, but it can also be a sign that the uptrend is strong. |
| Ultimate Oscillator | The Ultimate Oscillator is a momentum indicator that combines several other momentum indicators into a single indicator. When the Ultimate Oscillator is |
Conclusion
Crypto trading indicators, when used appropriately, can be valuable tools for traders seeking insights into market trends, identifying potential trading opportunities, and making informed decisions.
Also read: The Best Cryptocurrency-Friendly Hotels and Resorts in the USA
 What are the reasons for the withdrawal jump from Binance?
 Top 10 Binance Alternatives and Best Crypto Exchanges
 Best Play to Earn Crypto Games
 Bitcoin Cash Casinos in 2023
 Will Cryptocurrency Take Over the Casino Industry? 4 Key Steps in the Crypto Revolution
 Initial Steps in Online Gambling with Cryptocurrency